;)
Uplift’s 20,000 new police officers
Back in August 2019, we published a blog post about what 20,000 new officers would contextually bring to front-line policing. The outcome assumed was that Police services would reach levels of officers not seen since 2009/2010, and national operating numbers would be bolstered back to a place prior to austerity, but also see an inexperienced collective grow across police services.
Where did these officers go?
Since October 2019, the Home Office has been providing allocations to services against the Uplift target whilst also backfilling roles lost through normal working processes. As mentioned in 2019, many chief officers were vying for fair portions of recruitment, with some hoping to potentially see large improvements to their strength off the back of the recruitment initiative.
The visual below shows the total allocation given to every police force and then totalled by their respective regions. The Metropolitan Police and wider London area received the most officers by allocation, prospectively taking 23.7% of all officers recruited under the Uplift initiative. Unsurprisingly, the other large singular force allocations go to those with the largest populous with Greater Manchester, West Midlands and West Yorkshire all getting considerable portions of the 20,000 new officers.

Looking at the next figure down, this shows the total numbers of officers actually recruited above or below the respective allocations shown in figure 1, all but the Metropolitan police recruited more than their initial allocation with the London based police service falling short of their allocation by 1,089. The Met’s shortfall however is to everyone else’s gain, freeing up those slots and allowing for higher allocation intakes on top of their ‘additionally supported’ recruitments. Overall, the remaining forces recruited 2,018 more officers than their recruitment targets, aggregating at 951 over allocation across the forces observed against the 20,000 uplift figures.

Whilst these additional recruitment numbers should be celebrated, no doubt adding to the potential resourcing of investigations and increasing the chances of being more visible, questions will no doubt be raised about the logistical challenges such as training, onboarding and facilities in accommodating all these new recruits.
Have Uplift targets been achieved?
As mentioned above and published in the most recent quarterly update on 26 April 2023, the total recruitment of uplift is 20,951, though how do these numbers present themselves nationally?
The figure below shows the FTE count by officer role nationally from 2010-2023

Irrespective of training stage, nationally we’re now seeing the largest number of police constables over the last 13 years by FTE, a net increase of 6,251 since 2010. The impact of the Officer uplift can clearly be seen since the initiative took place in 2019.
One note to focus on however, is that with this new rise in the number of Constables there has not been a proportionate rise in Supervisors. In fact, the number of Sergeants and Inspectors have reduced since 2010 by 1,839 and 647 respectively.

The supervisory ratios of policing appear to be reducing, with a 2.2% proportionate increase in Constables, whilst a 1.7% reduction of Sergeants. This has increased the national PC to Sergeant ratio from 4.7 FTE of Constable per Sergeant to 5.4 FTE, It would be expected to assume that some sergeants, and also some forces overall would be more adversely affected by these growths than others.
The inexperience an officer uplift brings
With 20,951 by headcount being brought in under the Officer Uplift initiative, it likely goes to assume that there’s be a large proportion of a forces strength that would be expected to have a low level, or near no, policing experience.

Whilst a higher number of officers is beneficial in the long run, a growing demand portfolio in both volume and complexity combined with the amount of tutoring required to bring new officers into the fold can put a considerable strain on an already stretched response policing function. Police Forces such as Bedfordshire and Kent, who have 45% and 42% respectively of their officers with less than 5 years of service could see challenges across the coming years of operational quality.
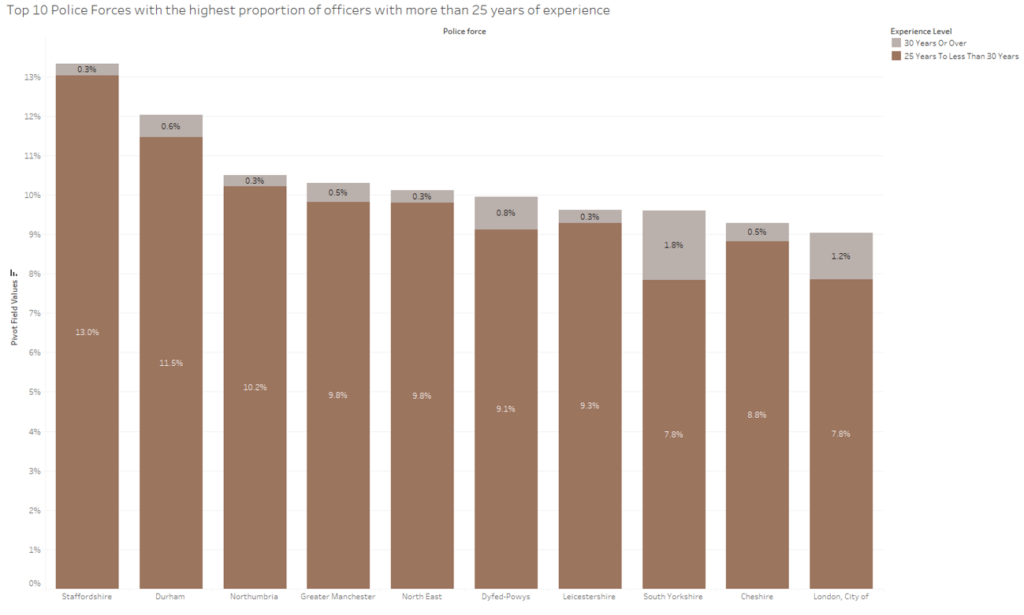
In counterpoint, Staffordshire and Durham may find themselves with a slightly more balanced workforce, since they have 13% and 12% of their forces with over 25 years of experience. Though, with all individuals, this proportion of the force could be expected to retire over the next 5 years, further compounding the inexperience gaps seen at these forces.
Conclusion
Uplift’s baseline objective was to recruit 20,000 new police officers. It’s done that, clearly seen in the numbers published and, for the most part, to the initial benefit of almost every eligible police service in the UK. The only caveat? It’s returned us to the numbers seen in 2010, not to new staffing heights equipped to deal with a higher caseload.
The questions now lie on the future. Supervisory ratios appear to be stretched further than before, perhaps ever; partnering this with a increasingly complex crime mix and a more inexperienced workforce could unearth a multitude of challenges.
Police Services around the UK will need to look at their workforce planning, aligning their new numbers with the most appropriate departments and creating a strategy that not only enables effective and proactive investigation, but incentivises retention.
By Matt Gill – Analytical Consultant