;)
What do the headlines say?
News headlines often paint a bleak picture of rising crime across the UK. Home Office data published in October 2022 resulted in numerous headlines across news sources such as “Violence and rape drive recorded crime to a new high in England and Wales” from Sky News. It has been well established since the 1980s that pessimistic news articles about crime volumes negatively affect the public’s perception of crime volume and, by extension, of law enforcement’s abilities and efficiency. Does the data support the narrative of rising crime?
What is happening to crime volumes?
The Home Office publishes a rolling three years of crime data for each force in England and Wales. Figure 1 below is based on this data, demonstrating the number of crimes recorded per month in England and Wales since June 2020.
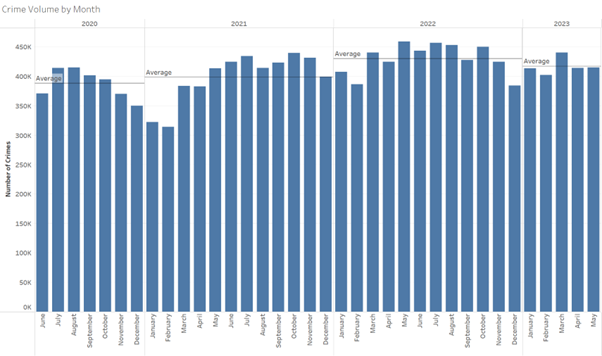
The overall volume of crime recorded in England and Wales is increasing. It’s also clear that there is seasonality in crime volumes within the average year, with summer months seeing the highest volumes of recorded crimes, and winter the lowest. The number of crimes recorded per month averaged 409k in the period since June 2020. For comparison, equivalent historical data is available for 2011-2013, which saw an of average 373k crimes recorded per month (9% less).
It is important to note that, from 23 March 2020, for much of the next two years there was some form of social restriction due to the COVID-19 pandemic across most of the country, which has affected the numbers of crimes committed and recorded during that period. It is difficult to know at this stage exactly what affect these social restrictions had on the volume of recorded crime; however, a new post-pandemic normal level appears to be emerging in 2022-2023.
What is happening to the type of crime being committed?
As well as the volume of crimes recorded, the Home Office also provides data on the type of crime committed. Figure 2 shows the trend across time for the proportion of crimes committed broken down by type.
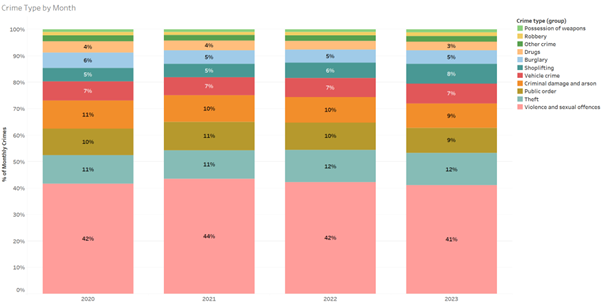
The five largest categories of crimes recorded have remained relatively steady through time. It would be beneficial for violent and sexual offences to be broken down into further subcategories in the same way as economic crimes, as trends in the subcategories of violent and sexual offences may be missed and the full picture therefore not provided.
What is happening to crime volumes across the regions of England and Wales?
It is worth examining whether the same trends occur across all Forces, as there is great diversity in the types of areas that Forces cover. Figure 3 shows the type of crime as a proportion of all crime recorded by region.

The national trend is roughly matched by most Forces; however, there are some notable outliers. City of London Police have a much lower proportion of violent and sexual offences versus the national average, which is most likely due to the uniquely low number of people who reside in the Force’s area. The Metropolitan Police Service is also a notable outlier to the national trend, with much higher proportions of thefts and vehicle crimes recorded. The Metropolitan Police Service is also a notable outlier for the volume of crimes recorded, with almost twice as many recorded crimes as the second highest Force in this period.
What is the public perception of crime?
It is important to note that the Home Office crime data accounts for the number of crimes recorded and, therefore, we don’t know what the trend is in terms of crimes that have not been reported by the public to a Force. The Office of National Statistics publishes results from the Crime Survey for England and Wales (CSEW), which consists of interviews conducted with a sample of over 13,000 people on whether they have been a victim of crime, as well as their perception of crime. The visual below shows the CSEW results by year since it began in 1981.
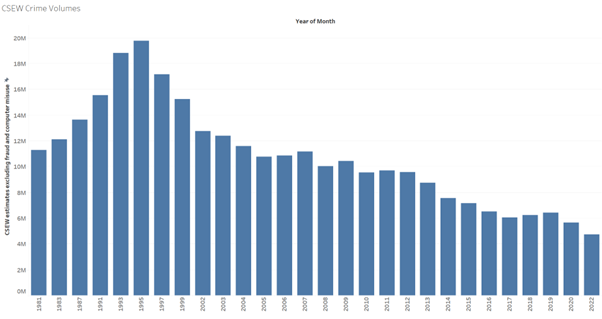
The CSEW results estimate that only 40% of crimes committed are reported to a Force by victims. The results from the CSEW shown in Figure 4 suggest that crime fell by 8% between 2020 and 2022, which is in direct contrast to the 11% growth in crime the Home Office figures suggest for the same time period.
Conclusion
Home Office data suggests that we are seeing a new normal level in recorded crime volumes. The volume of crime appears to be levelling out somewhat post-pandemic and the type of crime committed remains relatively unchanged. The trends are mostly the same across all Forces, however, the Metropolitan Police Service is a particular outlier that accounts for a very high volume of recorded crime and sees a different trend in crime type comparatively to other Forces.
Home Office crime data accounts for the number of crimes recorded and, therefore, we don’t know for certain what the trend is in terms of crimes that have not been reported by the public to a Force. If the CSEW estimates that only 40% of crimes committed are reported to a Force are correct, this suggests that potentially 60% of crime committed is not captured by the Home Office data, and that the real picture of crime experienced by the public may be more complex than the Home Office data illustrates and news headlines suggest.
By Sam Faulknall-Mills – Consultant