;)
State of the Force
The Metropolitan Police Service (MPS) is currently facing one of the most challenging times in its history. The Commissioner, Sir Mark Rowley, was appointed in September 2022 with a substantial agenda for change as his brief. One of the fundamental questions to be wrestled with is “what are the trends of crime in London?” An understanding of the nature of crime in London will inform the reform of the MPS now and into the future.
How many crimes occur in London?
The Home Office publishes a rolling three-year crime dataset for England and Wales, which can be filtered for the MPS. Figure 1 below is based on this data, demonstrating the volume of crime recorded for the MPS.

The MPS has seen average monthly recorded crime increasing steadily since the COVID-19 pandemic. If the current observed trajectory continues 2023 could be a record for recorded crime in the capital. This illustrates the scale of the challenge faced by the MPS in tackling crime in London.
What types of crime happen in London?
Our starting point is to analyse the crime mix within London and how it compares to other forces in England and Wales. Figure 2 below shows the type of crime as a proportion of all crime recorded for all reporting Forces versus the MPS.
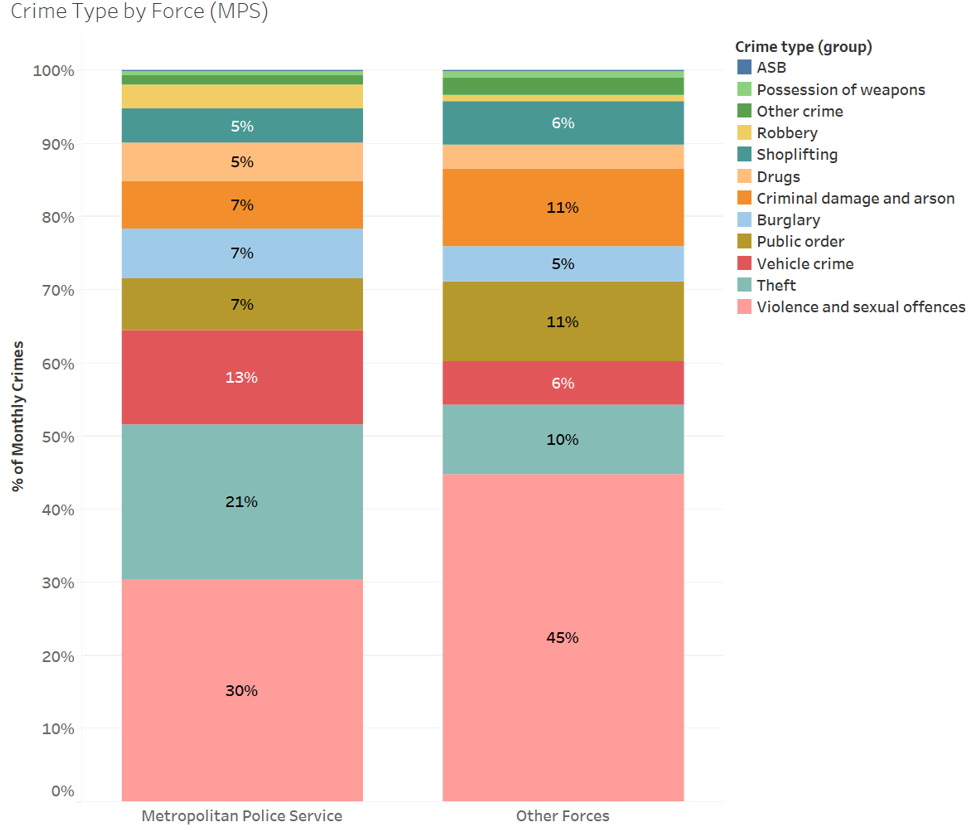
The MPS crime mix is an outlier to the national split, with much higher proportions of thefts (21% versus 10%) and vehicle crimes (13% versus 6%) recorded. An added element is that thefts have been rapidly increasing as a proportion of the MPS’s recorded crimes over time. In June 2021 thefts accounted for 15% of the MPS’s recorded crimes compared to 24% in May 2023. While theft has been increasing nationally, the rate of growth in theft crimes is much higher for the MPS and is a particular challenge. On the other hand, the proportion of crimes recorded for violent and sexual offences is much lower than the national trend (30% versus 45%).
Where does crime occur in London?
Figure 3 below shows every Lower Super Output Area (LSOA) in England and Wales where more than 10,000 crimes were recorded in the three years since June 2020.
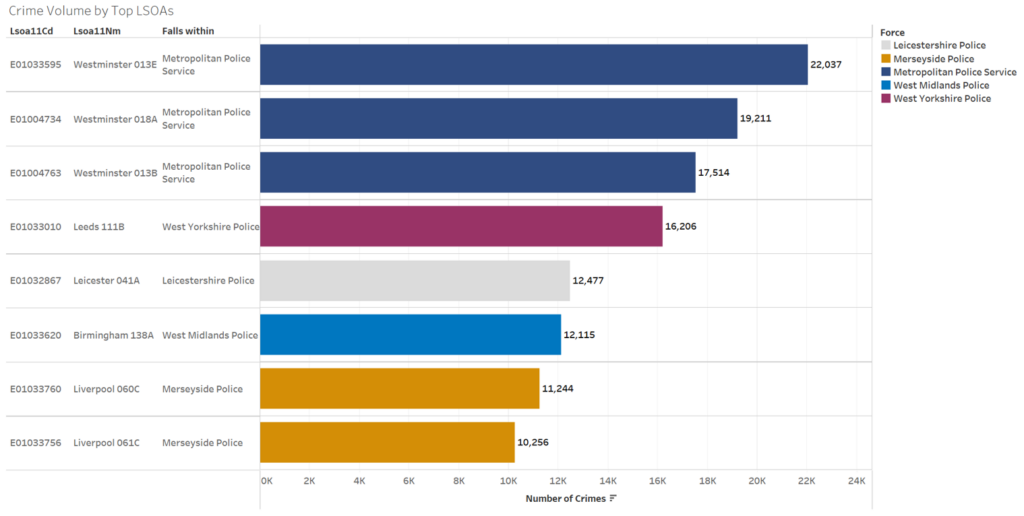
The three LSOAs in England and Wales with the greatest number of crimes recorded in the last three years are all within the MPS’ boundary. Crime will always be geographically focused on urban areas as this is where there is the greatest density of people, places and opportunity occurs, and this is particularly acute for a capital city such as London. However, even within London, there are spatial differences in the volume of crime. These three LSOAs have 92 times more crimes recorded compared to the London average.
It’s clear, therefore, that within London itself there are significant hotspots of crimes recorded. Figure 4 shows a map of the three LSOAs in London described above. The colouring on the map is blue for the lowest number of crimes, and red for the highest. The LSOA identifying code is labelled in white text.
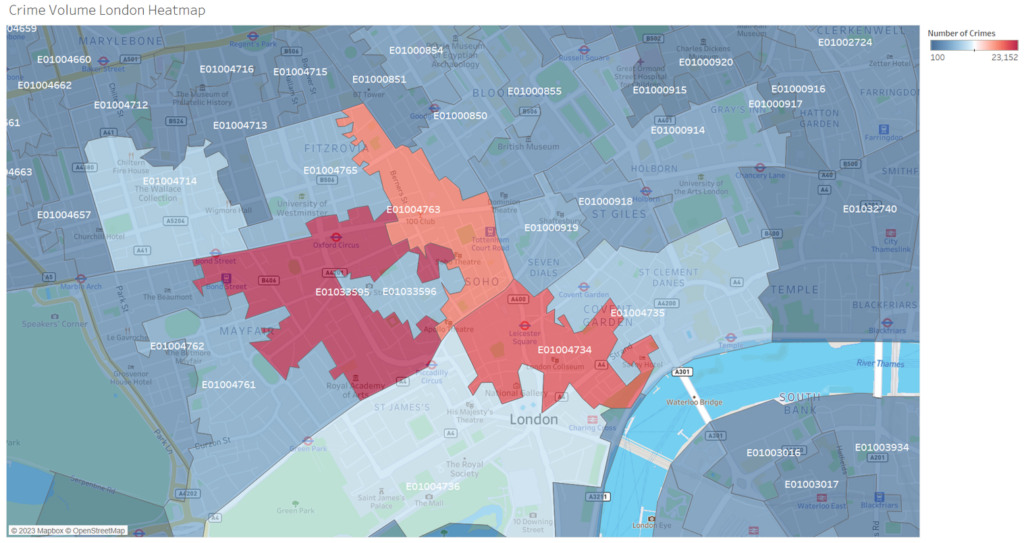
These three LSOAs, covering Oxford Street, Soho and Leicester Square, are some of the busiest shopping and tourism locations in London. The types of crime within this hotspot reflect that theft accounts for 63% of the crimes recorded in these LSOAs, compared to the average across London of theft being 17% of crimes recorded. LSOA E01033596 is an interesting outlier in this locality, which covers the area around Carnaby Street and does not see as much crime as its surrounding LSOAs.
What is the outcome of crime in London?
The Home Office data also provides the outcome of crimes recorded. Figure 5 shows the outcome of the crime recorded as a proportion of all crimes, with “Null” meaning that no outcome is yet recorded.

these within the category “No suspect identified”. If these categories are combined nationally for comparison purposes, the national average is 73% of recorded crime resulting in an outcome of unable to prosecute or no suspect being identified. This compares to the MPS average of 82%. Compared to other Forces, the MPS has less success in positive action outcomes from recorded crime, such as suspects being charged or cautioned.
Figure 6 shows a deep dive into the breakdown of crime types where the outcome is a suspect charged, to give an indication of where the MPS is succeeding at charging suspects and where there may be challenges.

Comparing Figure 6 to Figure 2 illustrates that the MPS are having some success charging drug-related crimes, as these account for 20% of suspect charged outcomes when they are a relatively small proportion of crime recorded in London. Conversely, thefts only account for 3% of suspect charged outcomes, when theft is a rapidly growing segment of the crimes recorded in London, as discussed previously.
Conclusion
While the hurdles the MPS faces are significant and complex, it is possible to analyse the nature of crime in London to inform reform. A significant proportion of London’s crime is theft, particularly in certain exceptionally busy shopping and tourist areas in central London. Added to this, the MPS have a low proportion of suspects charged where the crime recorded was a theft. This is perhaps indicative of a focus on other crimes, such as drugs where there has been visible success in charging suspects, but risks overlooking a rapidly growing crime type in theft and potentially miss an opportunity to deter future growth in this type of crime.
By Sam Faulknall-Mills – Consultant